Task report
Opening a task report
The class's Tasks page lists every task given to the class. To open a task's report, click the task's name (or its card), or choose Task report in the task's ⋯ menu.
This report is very useful for following your students' work in the system day to day. At the top of the report you can move straight to the class's previous or next task.
How a task report is built
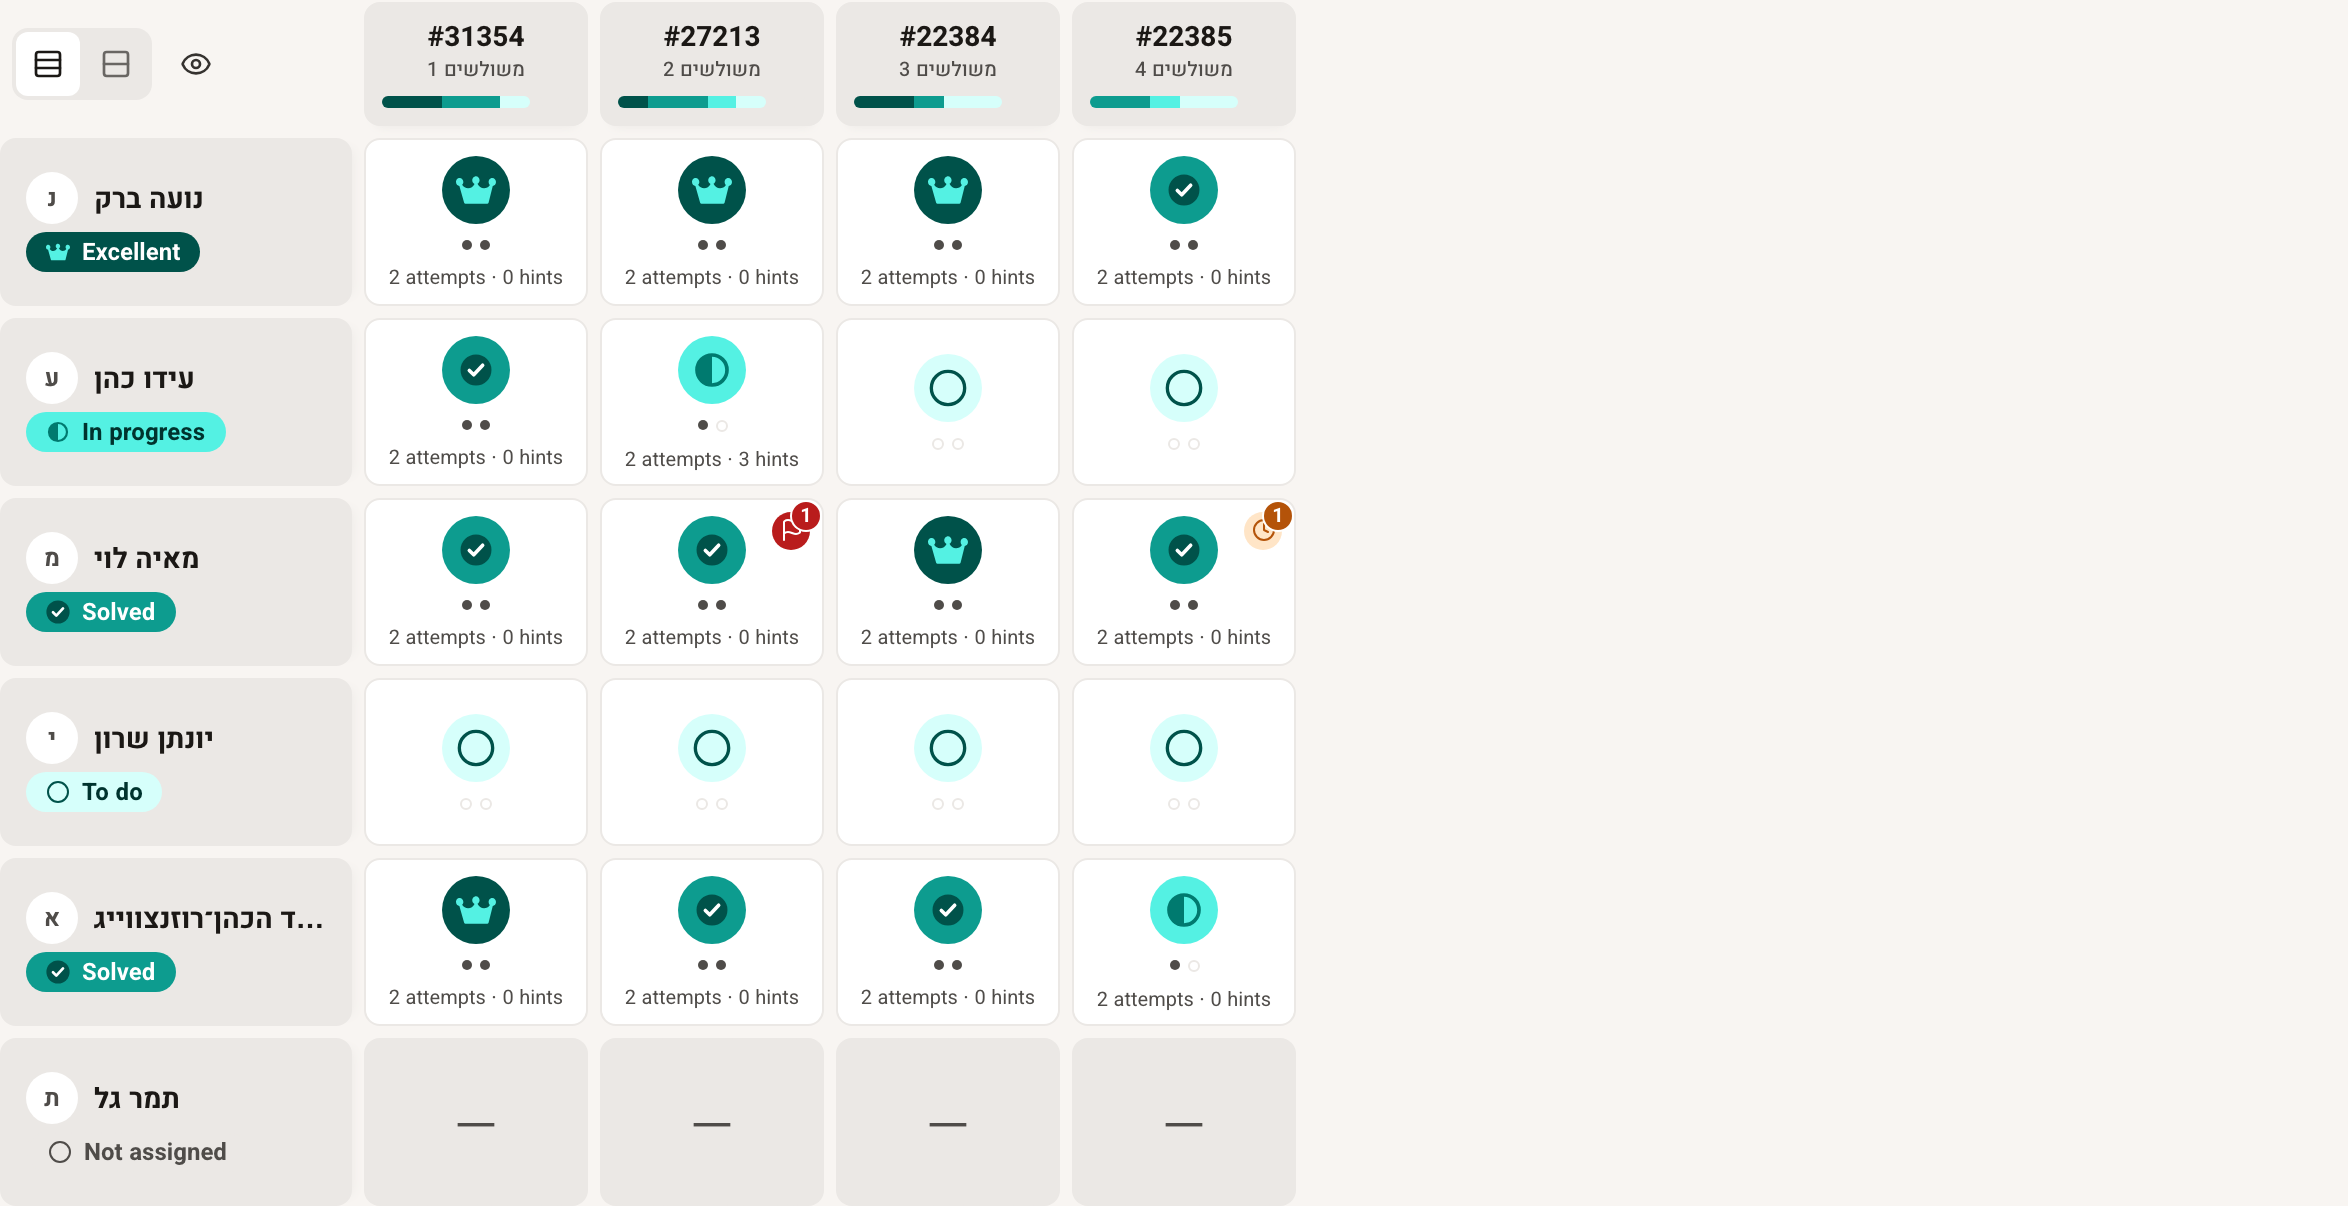
A task report is a table with a column for each question in the task and a row for each student in the class. Each cell shows the student's status on the question:
- Excellent – every item was submitted, and the question's score is 94 or more.
- Solved – every item was submitted, and the question's score is 59 or more.
- In progress – the student has started the question, but has not yet submitted every item, or the score is below 59. A solution that was written but never submitted for checking also shows as "In progress".
- To do – the student has not started the question yet.
- — (Not assigned) – the task was not assigned to this student.
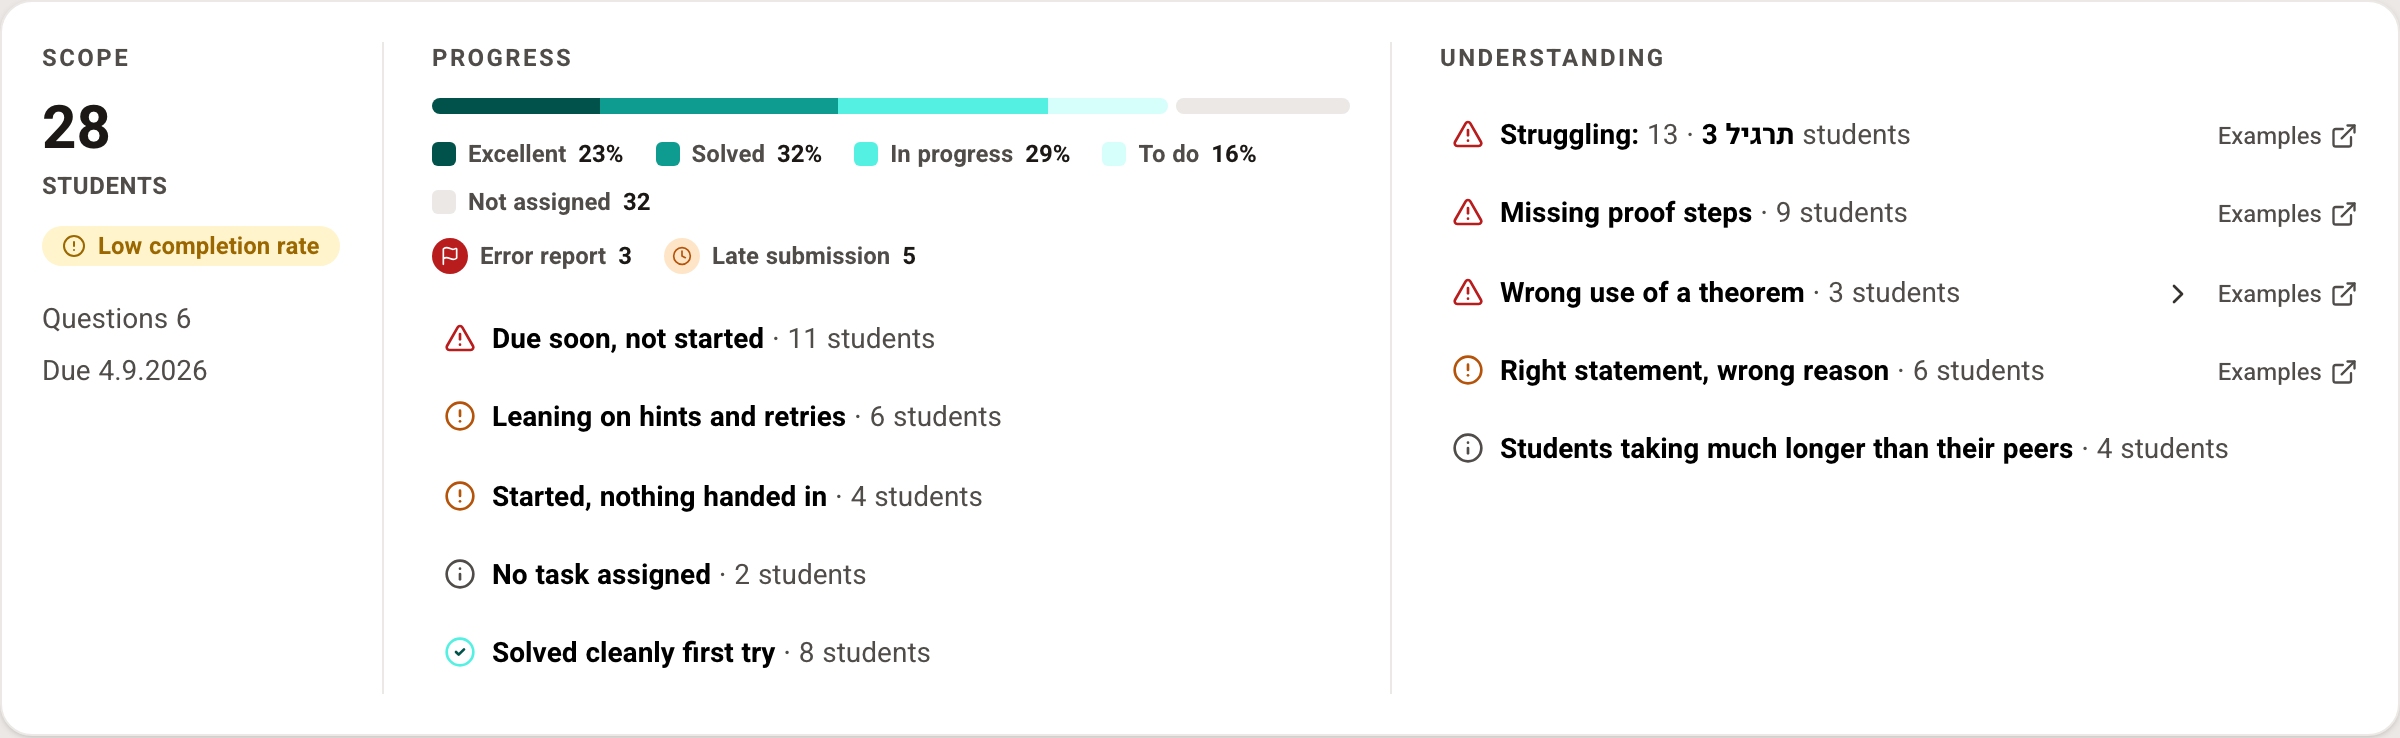
At the top of the page is a summary of the task: the number of students and questions, the due date, how all the cells divide by status, and insights about the task. The summary is also the table's legend: clicking a status or an insight highlights the cells it describes.
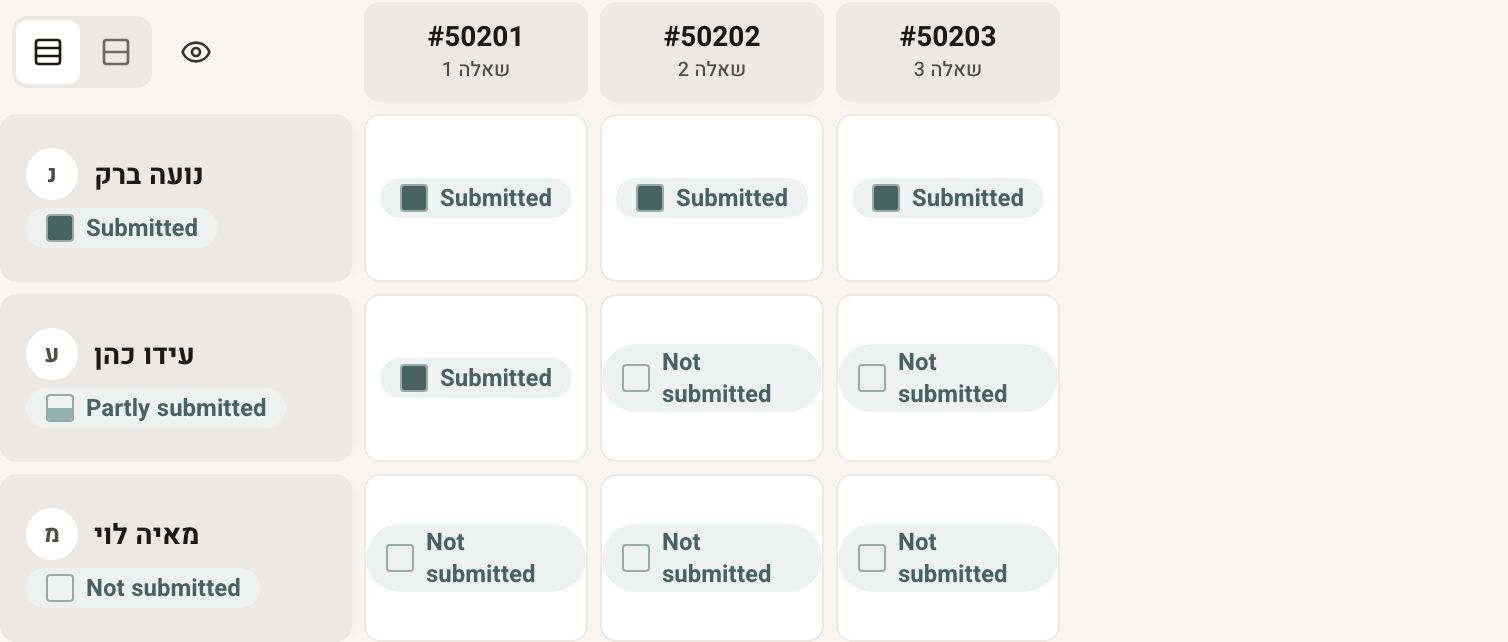
During a quiz (from the moment the class is waiting for it to start until it ends) the table shows only whether the student has submitted – Not submitted, Partly submitted or Submitted – and not how good the solution is. When the quiz ends, the table goes back to showing statuses.
Detailed and compact views
In the table's corner you choose between two views:
- Detailed – each cell shows the status, a dot for each item in the question (filled for an item that was submitted), and the student's number of attempts and hints on the question. A cell can also carry an Error report or a Late submission mark. Above each question is how the students divide on it, and beside each student is their status on the whole task.
- Compact – each cell shows the status only, so more questions fit across the screen.
Note! Every item needs its own submission, so solving a question with 3 items takes at least 3 submissions.
Next to the view choice is a Hide student names button, useful when you project the report in class. Clicking a student's name opens their student report, and clicking a question opens it in a new tab.
Viewing a solution
Clicking a cell (View solution) opens the solution – the last version the student submitted. From the solution you can save it to your library (Save to library) for later use. The saved solution stays available through its link even if the student changes their solution after you saved it. In the solution's ⋯ menu, All submissions shows every submission the student made on this question (see the All submissions page).
Exporting a task report to Excel
At the top of the task report is an icon (Export to Excel) that exports the report to Excel. The file has two sheets:
- The Students sheet – a summary for each student: the number of questions solved, average scores, the number of items, submissions and hints, and how many of their questions are in each status. Each question has a mark column and a Score column. The mark is V for a score of 94 or more, VX for a score of 59 to 93, and X for a score below 59 – the same thresholds as the Excellent and Solved statuses in the report.
- The Problems sheet – a summary for each question: how many students solved it, the average score, the number of submissions and hints, and how many students are in each status.